A quality meteorological station needs to be accurate, have a large storage capacity and its data need to be easily accessible. Meteo stations that exist do not have all these three qualities and are rather expensive for the hardware used. Furthermore each one has a closed ecosystem, so the data collected cannot be shared with other applications.
The Raspberry Pi is a low cost, low energy computer, with the addition of a 40-pin GPIO header. Its memory card slot and USB port means that there is an immense storage space and its ethernet port and wifi allows it to be accessible from the Internet. I have been using the Pi to control my WiFi light switches, so the setup for the meteo station is fairly simple.
The meteo station monitors the following values:
- External temperature and humidity
- Room temperature and humidity
- Barometric pressure
- Air quality
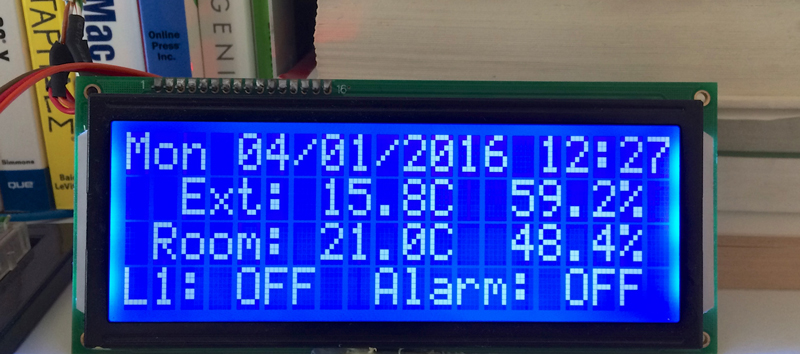
All of those measurements are recorded in a database to be analyzed and viewed on a webpage as well as are presented live on a small display.
The Hardware
The following sensors are used to gather all he measurements
- 2x AM2301 (DHT21) temperature/humidity sensors. Accuracy ±0.5C, ±3%
- BMP280 temperature/barometric pressure sensor. Accuracy ±0.5C, ±1hPa
- BH1750 light sensor. Accuracy 1.2x
- SGP 30 air quality sensor
- DHT11 temperature/humidity sensor. Accuracy ±2, ±4%
All of the above are shown on a 20x4 Large size LCD display, driven by an I2C display module.
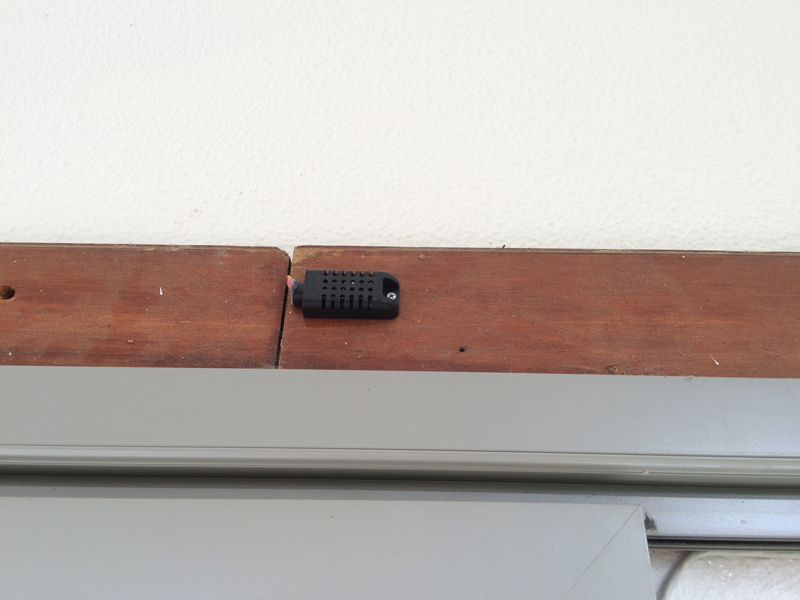
The AM2301 are medium quality, medium accuracy temperature and humidity sensors. The have their own case (important since one sensor will be mounted outdoors) and can operate with the 3.3V supplied by the Raspberry Pi. However, in this implementation, they are powered by 5V because of the long wire length (one of the sensors is external). They have a one-wire communication protocol, so, each sensor is connected to one GPIO port on the Pi (via a voltage translator).
The remaining sensors communicate using I2C. The display uses an HD44780 controller, which requires at least 7 GPIO ports for communication and one for the backlight. As this is not practical (many GPIO ports lost, lots of wires), an I2C module is used. The I2C display module, mounted at the display connector, translates I2C messages to the 7 GPIO ports needed. It can also operate the backlight. Therefore, only 2 GPIO ports are used for the display, the same ports used for all the rest of the I2C sensors.
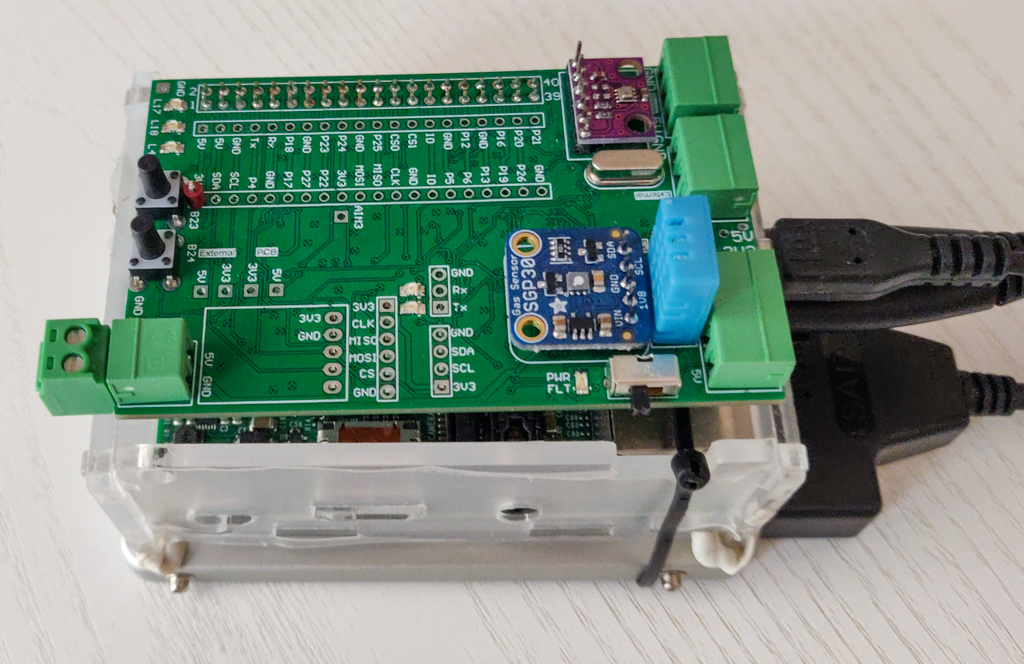
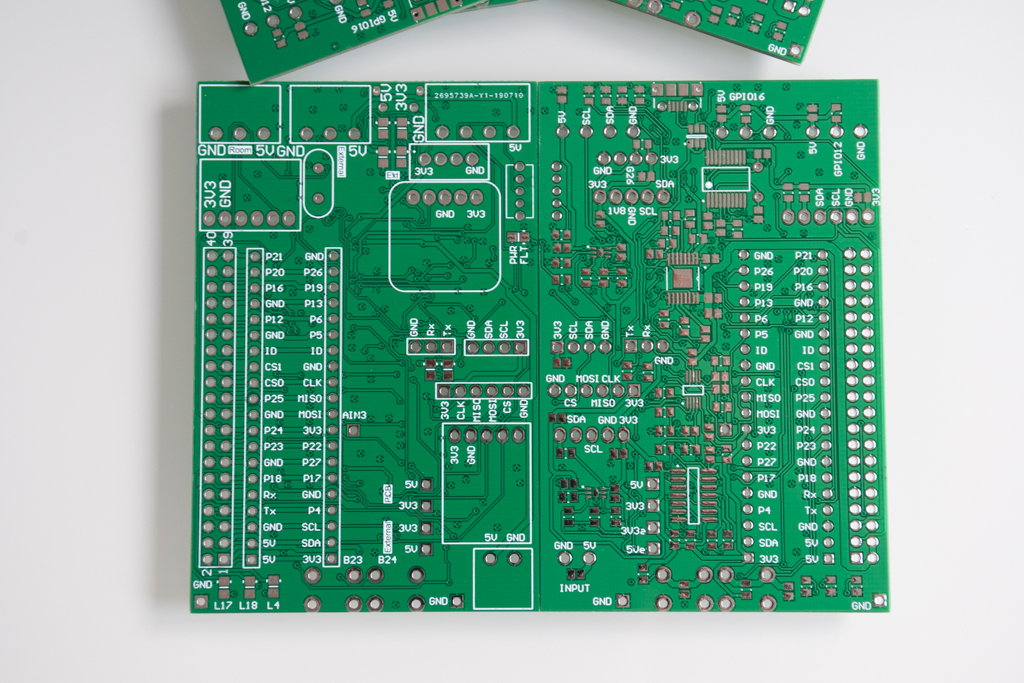
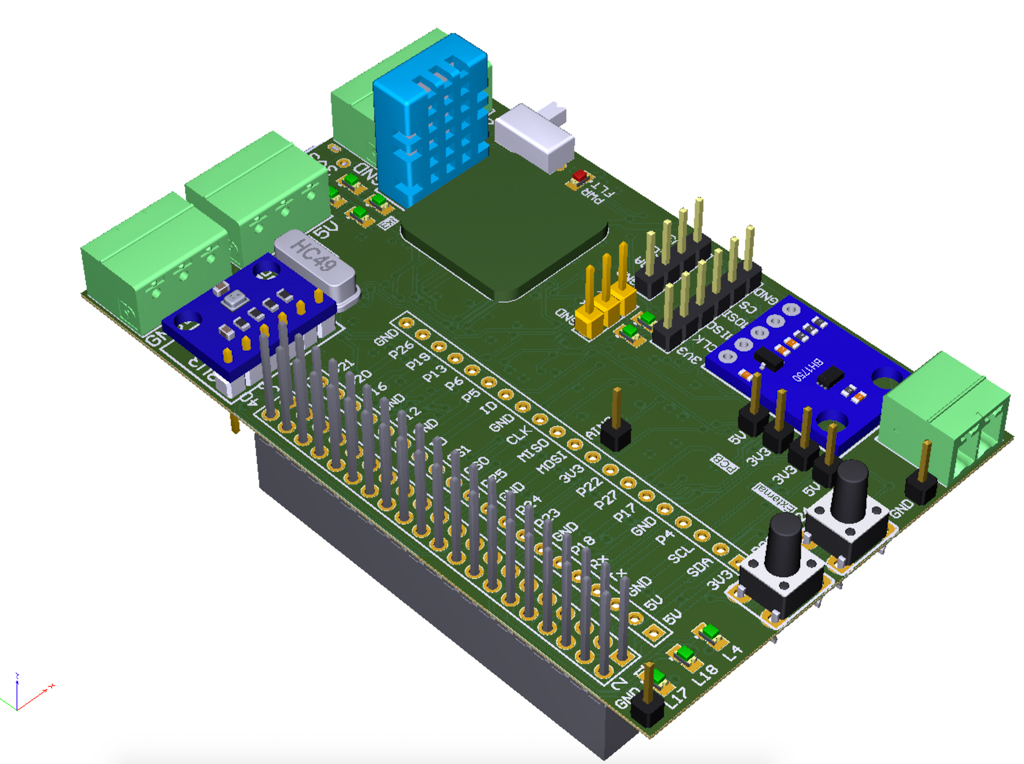
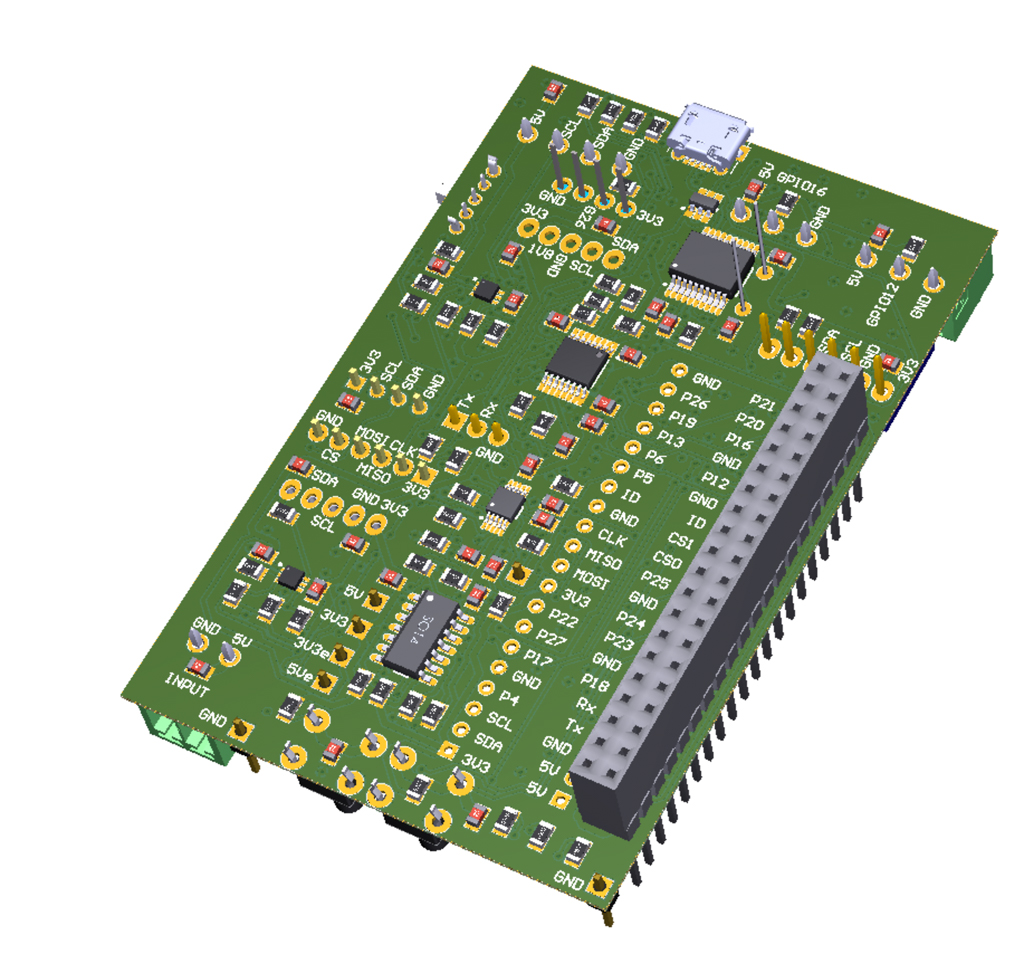
The schematic of the custom board is shown below. The 40 pin connector is in the middle with two 20 pin connectors on each side for prototyping and future upgrades. Three LEDs and two buttons are also installed. The lcd display backlight can be operated via an I2C command. Finally, the BMP280, BH-1750 and SGP30 daughter boards are mounted on the main board, whereas there are three connectors for the remaining hardware, two for the temperature/humidity sensors and one for the display. CAT-5 cable is used to connect to the external components.
As a custom PCB board would be built to house all the connections of the sensors to the raspberry pi, I chose to include some more components, to ease the installation of the meteo station:
- Micro-usb connection to power the PCB and the raspberry pi. It also has terminal (serial tx/rx) capability
- Secondary phoenix type 5V connector
- Undervoltage, overvoltage, overcurrent and reverse polarity input protection, either from the phoenix connector or the micro-usb connector
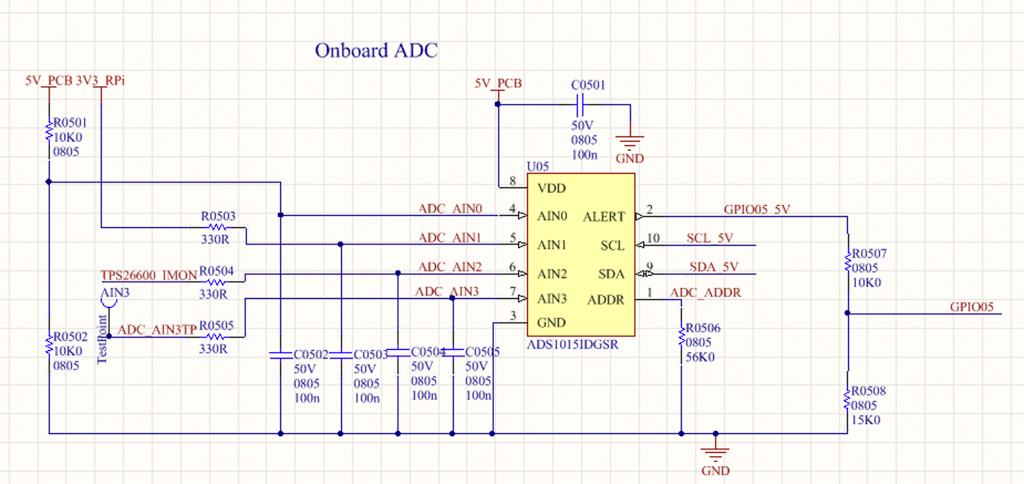
- Onboard ADC which monitors the 5V (input) and 3.3V (generated by the raspberry pi) rails, together with the current consumption of the station and a fourth unused channel.
- Connectors for all the on-board and external sensors
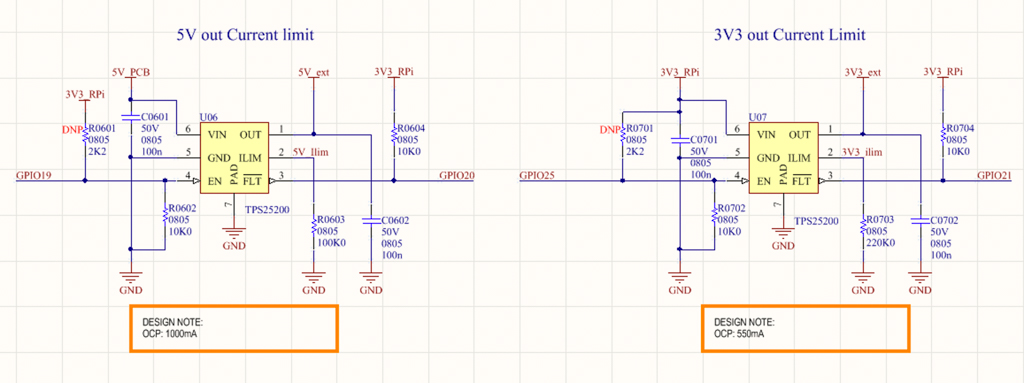
- Power switches for all the sensors connected externally, with overcurrent protection
- Buttons and LEDs for control and feedback
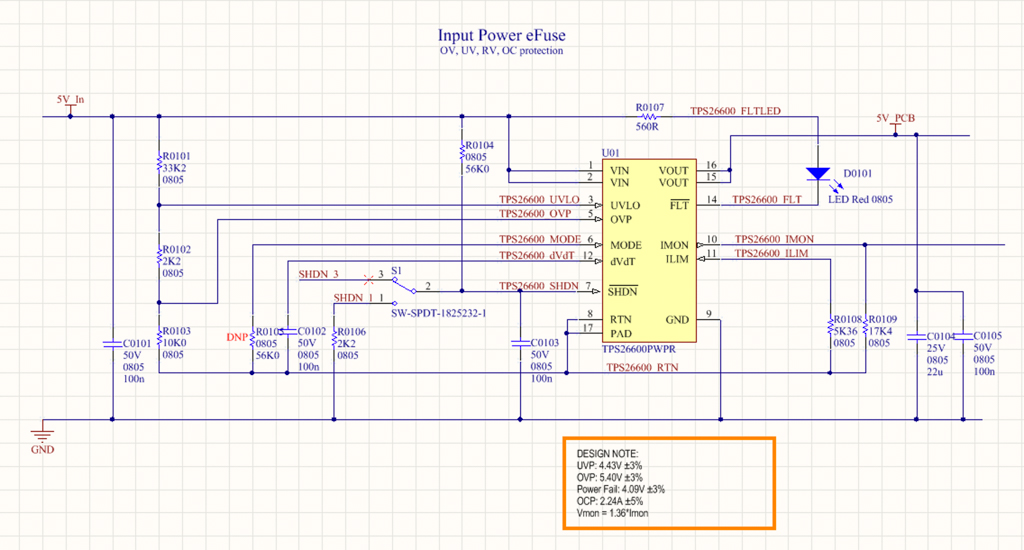
The main IC for the power supply is the TI TPS26600 eFuse. It has undervoltage, overvoltage and reverse polarity protection, together with overcurrent protectio and current monitoring. A switch is used to turn on and off the supply to the board.
The ADC used is the TI ADS1015 I2C 3.3kSps 12-bit ADC. The supply rails (5V and 3.3V) are connected to the ADC inputs via fixed value resistive dividers to monitor the voltage values. The rails are monitored and logged periodically to check the health of the in-circuit power distibution network. The 5V supply current is fed to the ADC directly from the TPS26600 IC and is similarly monitored.
For the externally connected sensors (temperature/humidity sensors) as well as for the display, the TI TPS25200 eFuse is used, which has an adjustable current limit. This ensures that a short on the external device, will not bring down the rail powering the internal sensors as well as the Raspberry Pi itself.
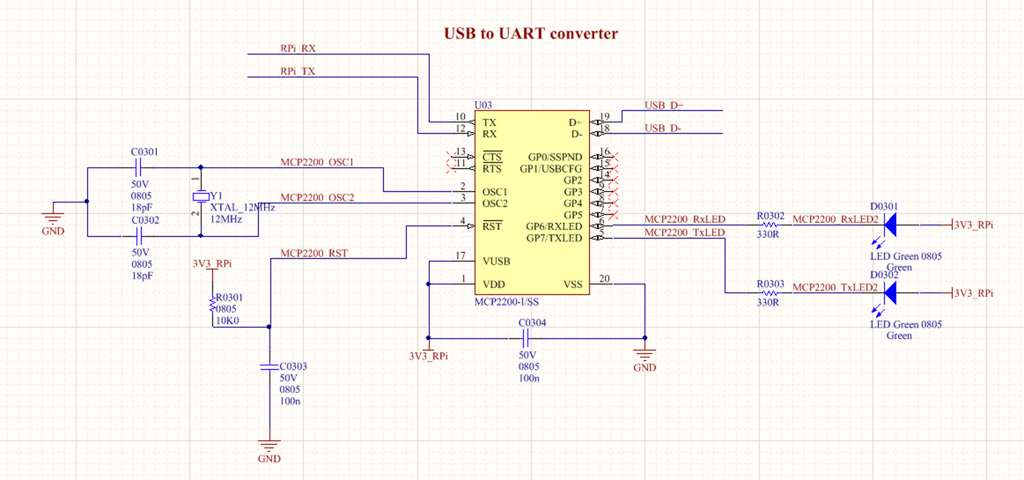
For the serial communication, the Microchip MCP2200 is used which translates the serial port to USB. Therefore, the micro-USB port of the PCB can also be used for communication, instead of the raspberry pi pins.
The Software
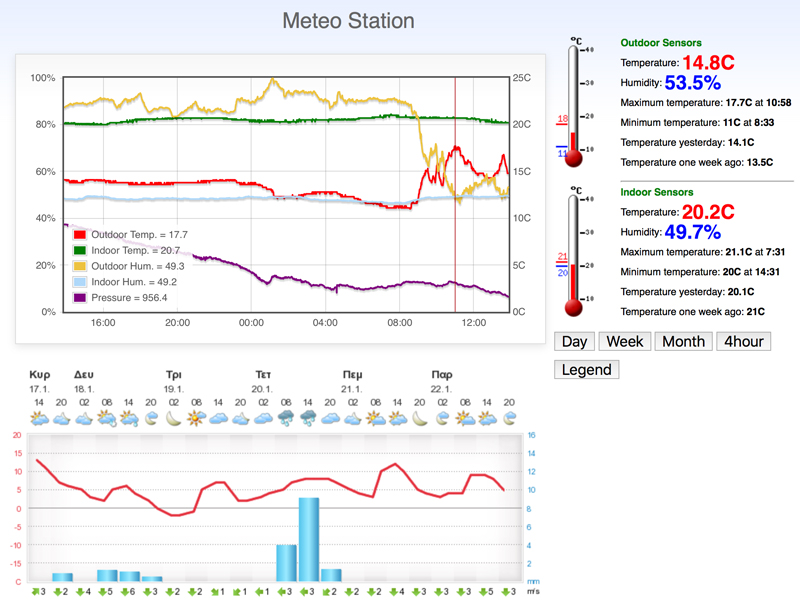
The software written is divided into two parts. First, there is the backend that gets the measurements every minute, stores them into a database and update the LCD. The display only shows the current measurements, due to the limited space. The data can also be monitored via a web client, where the current measurements are shown, together with a history of the past month, displayed as graphs.
So, to get the measurements and update the display, a program written in C launches every minute, via Cron. To get the measurements, subroutines are written for the BMP180 and the BH-1750, whereas the DHT22 driver is used for the AM2301 sensors. The WiringPi library is used to send the I2C messages. The messages are displayed to the LCD via a C program, based on the timing diagrams for the display. Finally, the CURL library is used to get the data from the Wi-Fi light switch and the MySQL library is used to log all the data to a MySQL database running on the Pi.
To display the data on the webpage, the Raspberry Pi runs an Apache Server. A PHP script is written to create the page, which gets the data from the database via JSON. A PHP script is used to display the temperature graphs and Flot is used to display the data charts.